 |
| After rising from 1000 to 5000 since 2009, the Nasdaq 100 Index is running out of steam as it heads into the target zone on Cycle Wave V in the portrayed Ending Diagonal pattern. The pattern could terminate at any moment and I give it 3-6 months at most before Wave V finishes. |
Tuesday, December 20, 2016

Sunday, May 15, 2016

Saturday, March 5, 2016
Nasdaq 100 Staged for Next Big Wave Down
 |
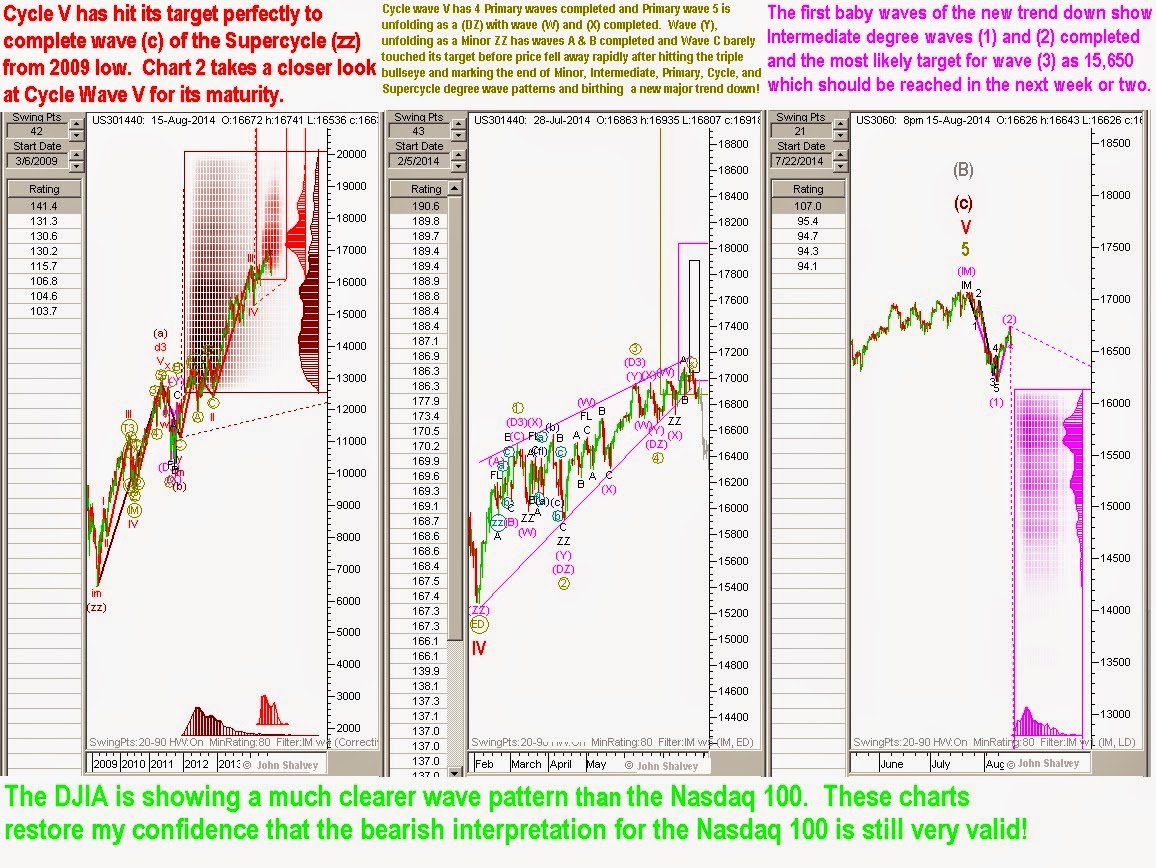
| Click on the chart to enlarge it so that it is easier to see the chart as well as the commentary above the charts. |
Thursday, December 3, 2015
S&P 500 May Have Created a Major Top
 |
| Click image to enlarge it and thus be able to read the description across the top of the charts. |
Sunday, October 11, 2015

Saturday, October 10, 2015

Monday, February 9, 2015

Friday, August 15, 2014

Thursday, August 14, 2014

Wednesday, August 13, 2014

Friday, August 8, 2014

Thursday, August 7, 2014

Monday, August 4, 2014

Friday, August 1, 2014


Thursday, July 31, 2014

Wednesday, July 30, 2014


Friday, July 25, 2014

Thursday, July 24, 2014

Subscribe to:
Posts (Atom)

