 |
| Begin reading Chart #1 in Upper Left and proceed counterclockwise for proper progression. |
Showing posts with label Currency Trading. Show all posts
Showing posts with label Currency Trading. Show all posts
Tuesday, September 17, 2013
GBPUSD Ripe for a Reversal

Friday, September 13, 2013
USDJPY nears epic turning point
 |
| Contracting Triangle final wave E is in its 3rd and final wave. Rally will follow for as long as it took the CT to complete. |
Tuesday, September 10, 2013
USDJPY's ugly twin. (The Bullish Interpretation)
 |
| Bullish Interpretation is not favored count currently, but remains a possibility to be prepared for. A break above Wave (1) high in chart #2 would be reason for concern. |
Monday, September 9, 2013

Sunday, September 8, 2013
USDJPY Wave C of ZZ Trade
 |
| Highest probable price target was chosen as profit target (highest peak on the Y axis histogram) and Stop order place just beyond the extreme of the ZZ pattern origin, which is where this pattern gets invalidated. |
Friday, September 6, 2013
EURUSD Ripe for Major Rally
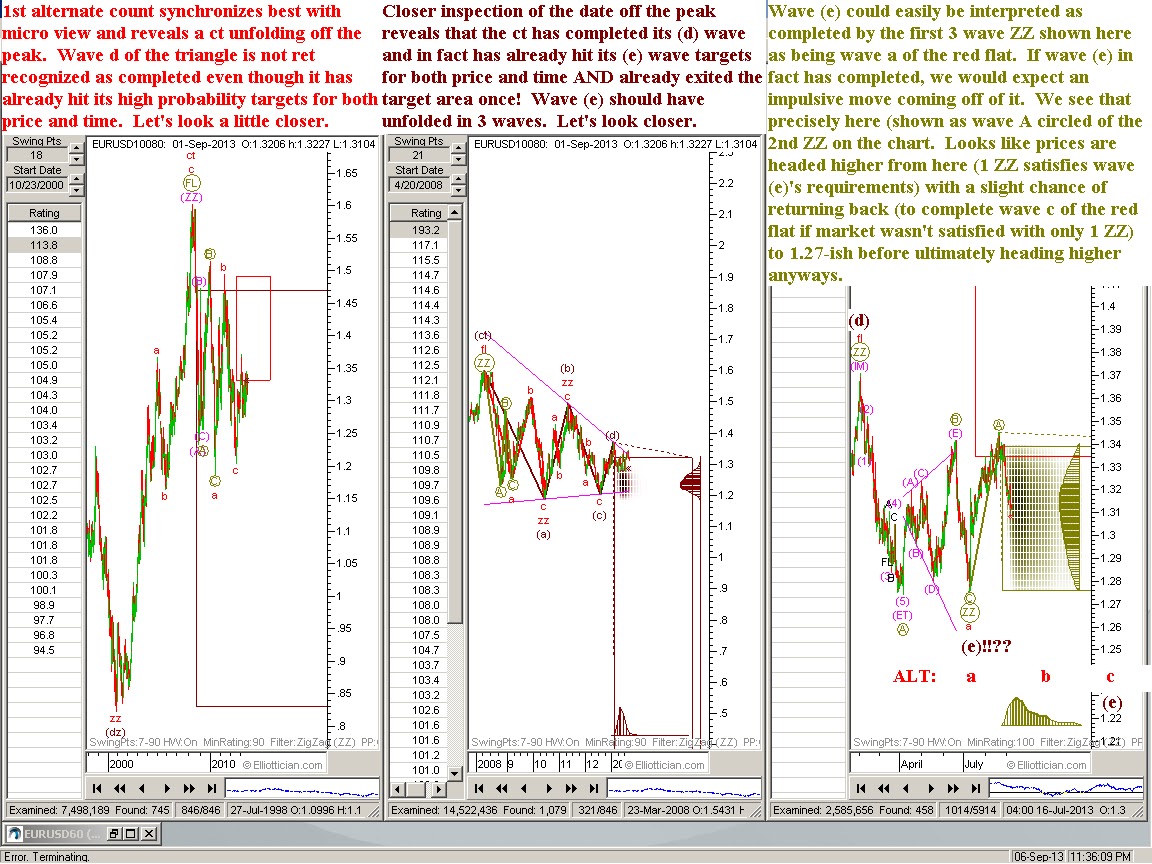 | ||||||||
| Expecting price to rally upward out of the khaki target box shown and never looking back (for several months anyway). |
USDJPY Two Scenarios
 |
| Slight dip ahead followed by a climb above 100.20 (likely to the 102-106 price area) |
Thursday, September 5, 2013
USDJPY Still stuck in the Contracting Triangle but not for long.
 |
| Small move down, then up, then a slightly larger move down again before the major uptrend resumes and the major Contracting Triangle exerts its powerful thrust to the upside. Blue line in the 3rd chart shows this expected future price action as a crude estimate. |
AUDCHF poised for final leg down in a Zigzag
 | ||||||
| AUDCHF appears to have completed 5 waves to complete wave C of a Flat. Next move should be significant to the downside, retracing all of this 5 wave move and then some. |
Subscribe to:
Posts (Atom)

