|
| Country View |
 |
| State View |
 |
| City View |
|
| Country View |
|
| State View |
|
| City View |
 |
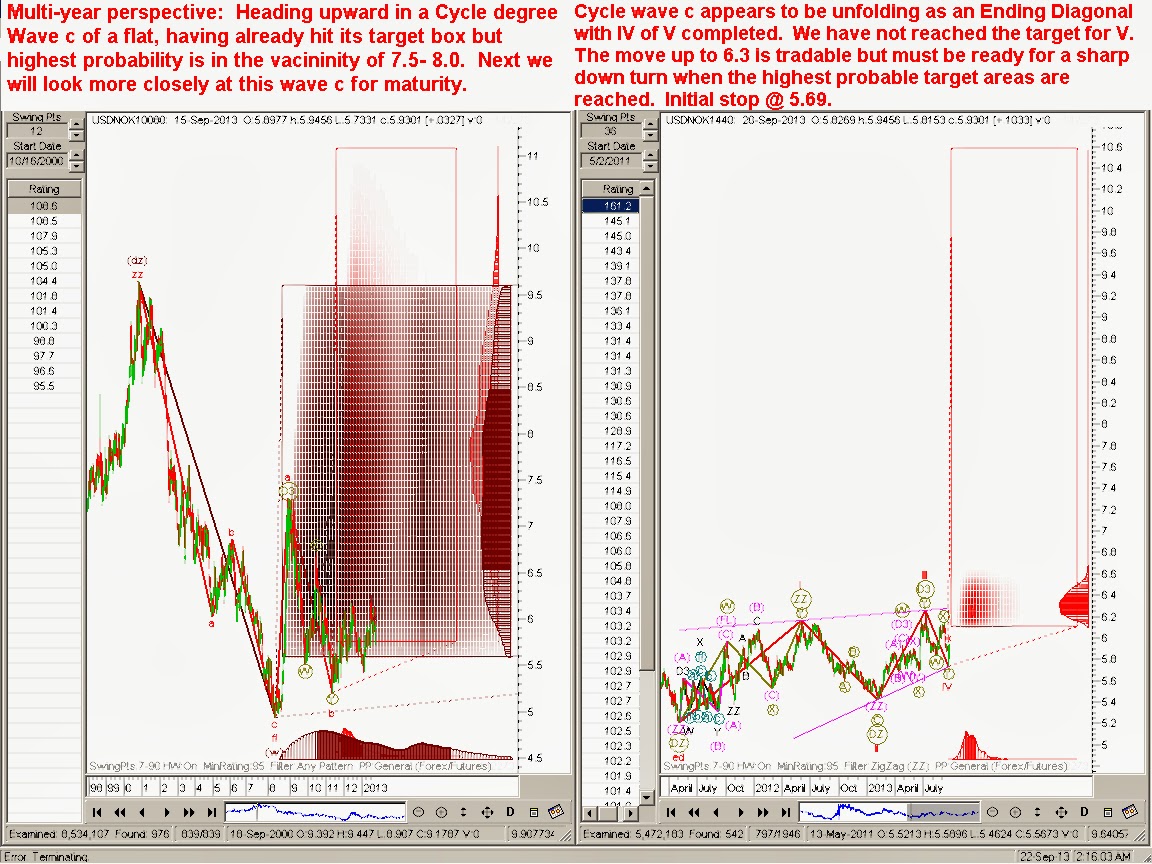
| The finish of the Ending Diagonal depicted in the chart at right, marks the end of the (ZZ) depicted in the chart at left, which then marks the end of the Primary degree Contracting Triangle. |
 |
| Turning to head south VERY soon! |
 |
| Wave 4 of Ending Diagonal completed. Heading up to wave 5 target. |
 |
| Wave (B) of (ZZ) eyes its target just slightly south. Wave (C) of Wave 5 up of the Ending Diagonal would then begin. |
 |
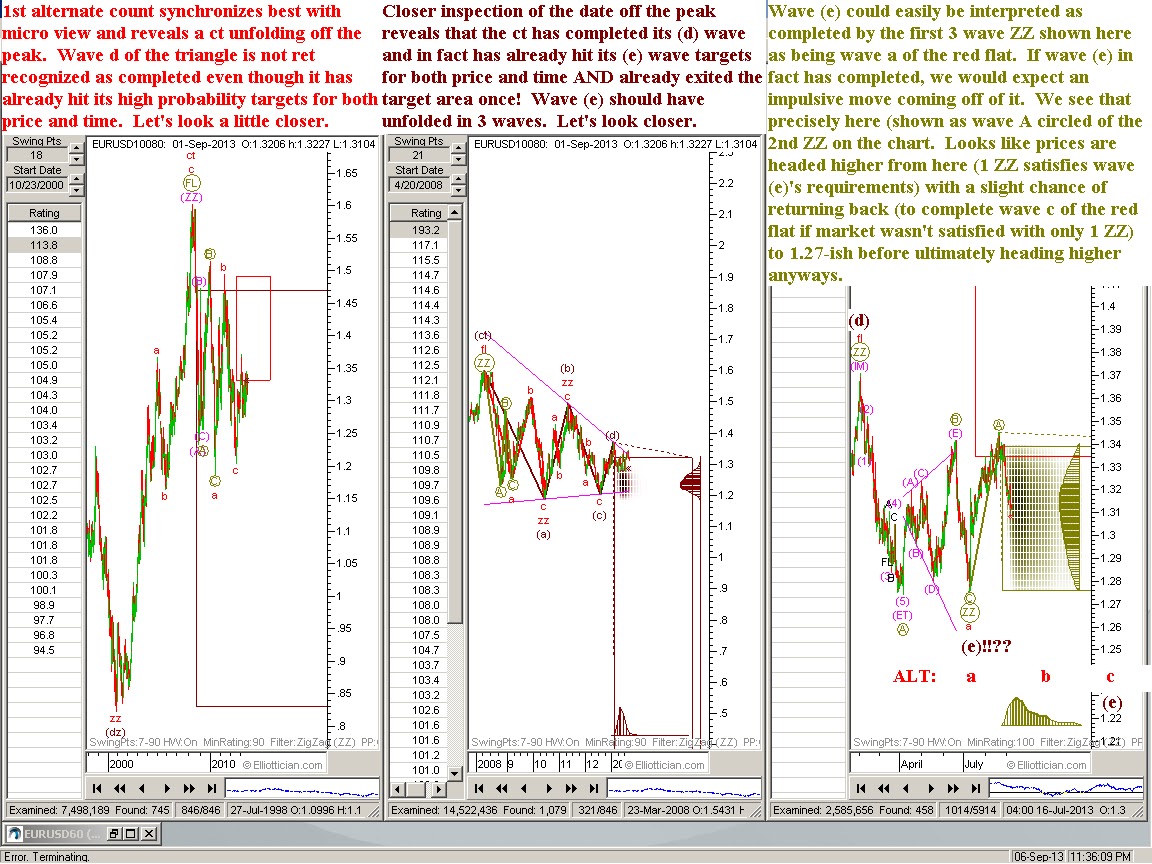
| EUR USD will go pretty much sideway for a while before giving a modest upward thrust before a substantial sell off occurs. All this should happen by year's end. |
 |
| Chart #1 Multi Month / Multi Year Perspective |
 |
| Chart #2 Multi Month Perspective |
 |
| Chart #3 Multi Day / Intra Day Perspective |
 |
| Begin reading Chart #1 in Upper Left and proceed counterclockwise for proper progression. |
 |
| Bullish Interpretation is not favored count currently, but remains a possibility to be prepared for. A break above Wave (1) high in chart #2 would be reason for concern. |
 |
| Highest probable price target was chosen as profit target (highest peak on the Y axis histogram) and Stop order place just beyond the extreme of the ZZ pattern origin, which is where this pattern gets invalidated. |
 |
| Hourly candles are shown on right chart and reveal a micro look. This is an opportunity to get a high reward/low risk entry, as your Stop order is nearby. |
 | ||||||||
| Expecting price to rally upward out of the khaki target box shown and never looking back (for several months anyway). |
 |
| Slight dip ahead followed by a climb above 100.20 (likely to the 102-106 price area) |
 |
| Small move down, then up, then a slightly larger move down again before the major uptrend resumes and the major Contracting Triangle exerts its powerful thrust to the upside. Blue line in the 3rd chart shows this expected future price action as a crude estimate. |
 | ||||||
| AUDCHF appears to have completed 5 waves to complete wave C of a Flat. Next move should be significant to the downside, retracing all of this 5 wave move and then some. |