
Wednesday, December 18, 2013
Sunday, December 15, 2013

Wednesday, December 11, 2013

Tuesday, December 3, 2013

Tuesday, November 26, 2013

Thursday, November 21, 2013


Friday, November 15, 2013

Monday, November 11, 2013
Perfect Opportunity to Short EURJPY with Tight Stop
 |
| EURJPY Very High Reward to Risk Ratio! Near Perfect Set Up! |
Friday, November 8, 2013


Thursday, November 7, 2013
NASDAQ 100 Sell Off Today NOT the Crash...YET!
 |
| Nasdaq 100 sold off heavily today but it looks like a sharp wave 4 correction (see chart on right). Next we expect a wave 5 rally to complete Primary 3 (see chart in middle). Then a Primary 4 pullback is expected before Primary 5 up completes Cycle III (see chart on left). We would then have Cycle IV & V before the imminent CRASH! |
Wednesday, November 6, 2013


Friday, November 1, 2013

Thursday, October 31, 2013


Wednesday, October 30, 2013

Tuesday, October 29, 2013
Nasdaq 100 Top Wave Count
 |
| If the FED disappoints at tomorrow's 2pm announcement, it could be a catalyst to send the market down and complete Cycle wave V! |
Nasdaq 100 inches closer to a top!
 |
| Interpretation is a little bit tricky (appropriately so for this time of year) but not so much so to spook me away from posting an interpretation of the current price action. Black lines connect the waves as I drilled down to closer time frames, while blue line reflects my predicted price movement including best guess for a wave V high. |

Friday, October 25, 2013
Nasdaq 100 continues to show clear wave counts as top approaches
 |
| Nasdaq 100 likely will bleed down for the next 1 to 2 days before beginning its ascent to the final peak of wave (5), which will likely take 4 - 6 trading days to complete. Then CRASH will begin. |

Thursday, October 24, 2013

Nasdaq 100 Mid-day Chart Bearish in a 4th Wave
 |
| Cycle Wave V unfolding as a Primary ZZ with final wave C in the midst of its wave 4. |
Tuesday, October 22, 2013
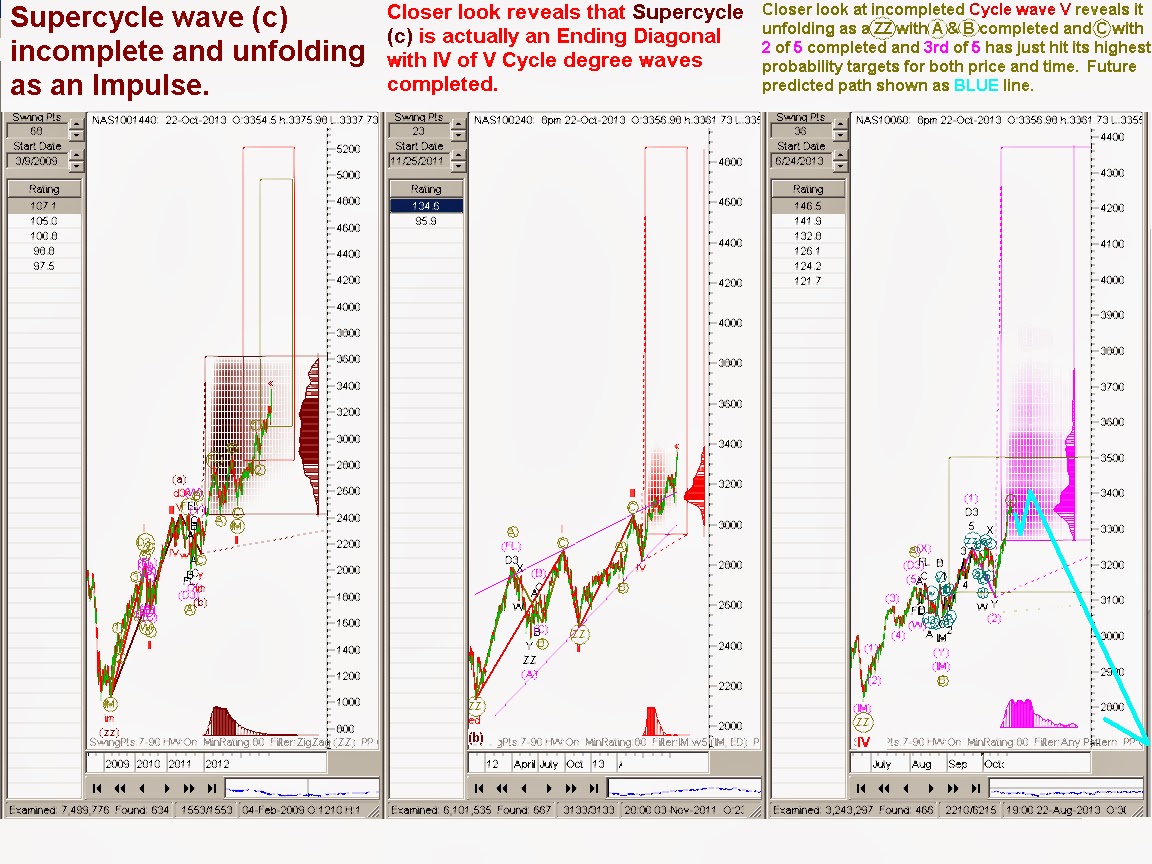
Monday, October 21, 2013

Sunday, October 20, 2013


Friday, October 18, 2013
NASDAQ 100 Futures Ripe for a Minor Pullback
 |
| It appears that today's rally has taken price to its target for wave (3). Am expecting wave (4) pullback next. |

Thursday, October 17, 2013
Nazdaq 100 futures due for a few days cooling off.
 |
| Wave (4) will be a modest cool off for the blazing Nasdaq 100. Not much more room for wave C of the ZZ to finish. |

Monday, October 14, 2013
Nasdaq 100 to reach peak in 2-4 weeks
 |
| Pink wave 3 is shy of its target presently. Once hit, waves 4 & 5 will complete Khaki ZZ (circled) and mark the beginning of the collapse. |
Thursday, October 10, 2013
Higher near term high on the horizon for Nasdaq 100 but then what?
 |
| 3265 expected to be reached in 1-3 days. 3360 expected to be reached in 6-12 days. |
Tuesday, October 8, 2013
Nasdaq 100 makes a big fake-out in today's selloff
 |
| Today's sell off was nothing more than the completion of Minor wave Y, which completes Intermediate (2). Intermediate (3) to fresh highs is what should come next, then a minor sell off to finish Intermediate (4), and finally a minor rally to finish Intermediate (5). Expecting (3), (4), and (5) to unfold rapidly before 10/17. |
Monday, October 7, 2013
USDJPY requirements for a trend change have been met. Maybe turning point!
 |
| Country View |
 |
| State View |
 |
| City View |
Thursday, October 3, 2013

Wednesday, October 2, 2013
A couple more pushes to the upside remain for Nasdaq 100 before CRASH begins
 |
| It appears the Nasdaq has a few more fumes to burn before rolling over and crashing. Intermediate (3) up, (4) down, and (5) up must complete before wave C (circled) completes. This could all take about 4 to 8 weeks. When wave C (circled) completes, Cycle (red) wave V of the Ending diagonal will be completed. When Cycle V is completed, Supercycle (burgandy) (c) will be completed. When Supercycle (c) is completed, Grand Supercycle IV down will be underway. This Grand Supercycle Wave IV should bring the Dow Jones Industrial Average to a price below 1,000! |
USDJPY close to finishing a major Contracting Triangle
 |
| The finish of the Ending Diagonal depicted in the chart at right, marks the end of the (ZZ) depicted in the chart at left, which then marks the end of the Primary degree Contracting Triangle. |
Saturday, September 28, 2013
QLD Presents Trade of a Lifetime!
 |
| This is one of the greatest shorting opportunities that I have ever seen. |
USDJPY Update
 |
| Intermediate Double 3 Wave (Y) is in its target. When will it turn? |
 |
| It can be interpreted that Intermediate wave (Y) is completed! |
Subscribe to:
Posts (Atom)

