 |
| Hourly candles are shown on right chart and reveal a micro look. This is an opportunity to get a high reward/low risk entry, as your Stop order is nearby. |
Saturday, September 7, 2013
EURUSD Short term view. Urgent trade opportunity!
Friday, September 6, 2013
EURUSD Ripe for Major Rally
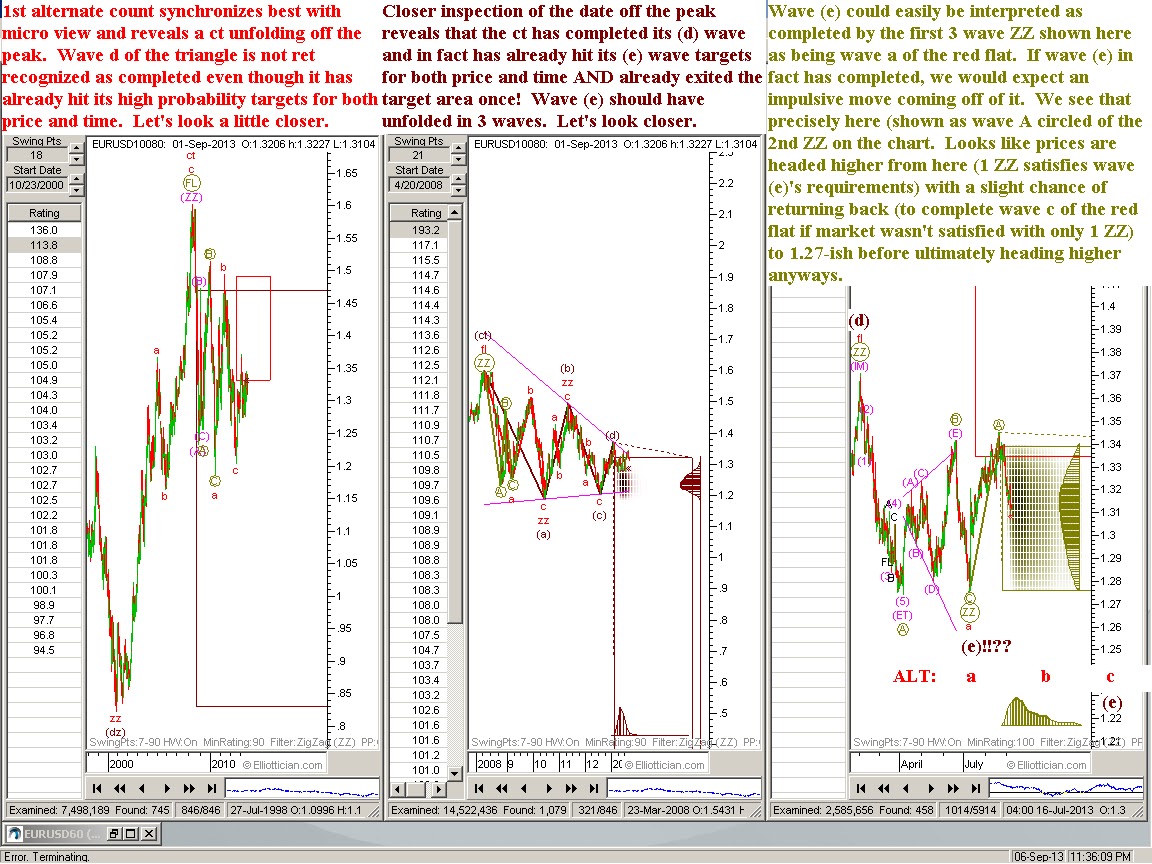 | ||||||||
| Expecting price to rally upward out of the khaki target box shown and never looking back (for several months anyway). |
Nasdaq 100 Final Wave of an Ending Diagonal Underway
 |
| Next week likely to be the last push upward for the markets. |
USDJPY Two Scenarios
 |
| Slight dip ahead followed by a climb above 100.20 (likely to the 102-106 price area) |
Thursday, September 5, 2013
USDJPY Still stuck in the Contracting Triangle but not for long.
 |
| Small move down, then up, then a slightly larger move down again before the major uptrend resumes and the major Contracting Triangle exerts its powerful thrust to the upside. Blue line in the 3rd chart shows this expected future price action as a crude estimate. |
Nasdaq 100 Final Wave on an Ending Diagonal Underway
 |
| One more sputter upward before major sell off to ensue. First phase of the sell off should take prices well below the origin of the Ending Diagonal. Price will retrace 100% of the ED move and then some more! |
AUDCHF poised for final leg down in a Zigzag
 | ||||||
| AUDCHF appears to have completed 5 waves to complete wave C of a Flat. Next move should be significant to the downside, retracing all of this 5 wave move and then some. |
Tuesday, September 3, 2013
USDJPY Breaking out of a Contracting Triangle to the Upside
 |
| USDJPY has just broken the upper channel line of a Contracting Triangle. Looking for explosive move to the upside over the next several months. |
Subscribe to:
Posts (Atom)

