 |
| Nasdaq 100 likely will bleed down for the next 1 to 2 days before beginning its ascent to the final peak of wave (5), which will likely take 4 - 6 trading days to complete. Then CRASH will begin. |
Friday, October 25, 2013
Nasdaq 100 continues to show clear wave counts as top approaches

Thursday, October 24, 2013

Nasdaq 100 Mid-day Chart Bearish in a 4th Wave
 |
| Cycle Wave V unfolding as a Primary ZZ with final wave C in the midst of its wave 4. |
Tuesday, October 22, 2013
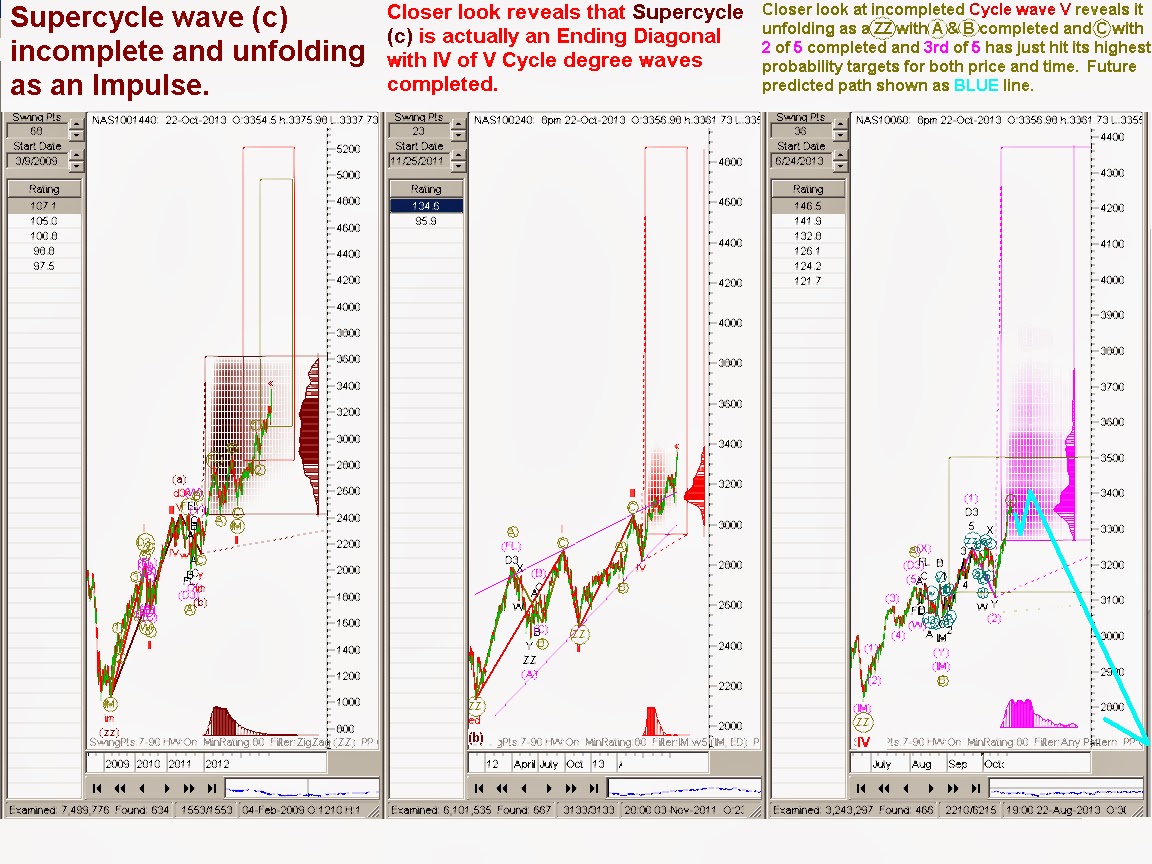
Monday, October 21, 2013

Sunday, October 20, 2013


Subscribe to:
Posts (Atom)

