 |
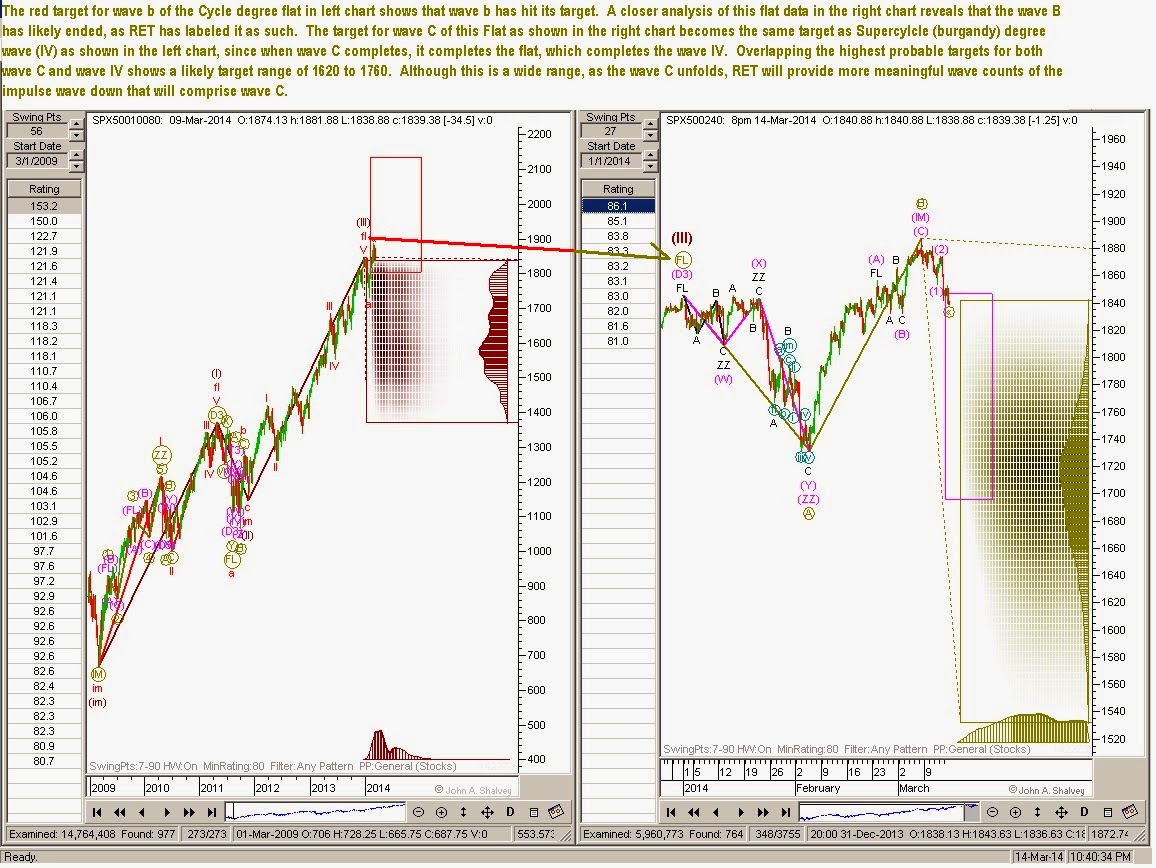
| The DJIA and S&P 500 appear to be walking in step with each other as both are heading south to complete an Impulse wave C of a Flat. When this Flat completes, most likely around 15,200, it will mark the end of Supercycle (burgundy in left chart) wave (IV) and leave room for one final push to an all time high as Supercycle wave (V) up will likely provide. That could put us about 4 to 6 months away from the all time high peak. |
Saturday, March 15, 2014
DJIA Heading South to Complete Supercycle Wave (IV)
Friday, March 14, 2014
S & P Fading South as Impulse Wave C Unfolds as Predicted
 |
| Like what you see? Get private equity money management utilizing the Wave Principle by calling 614-525-1429. Leave your contact information. Fee structure: 2% one time up front, then 1 fifth of all growth (assessed quarterly). |

Wednesday, March 12, 2014

Tuesday, March 11, 2014
Nasdaq 100 Top Wave Count May Be the Beginning of Something BIG!
 |
| The Top Wave Count selected by Refined Elliott Trader (RET) has determined that Supercycle degree wave (y) has completed. This marks the end of Grand Supercycle Wave B, a very major turning point in the market if RET has it right! |

Nasdaq 100 Perhaps has Hit It's Major Peak
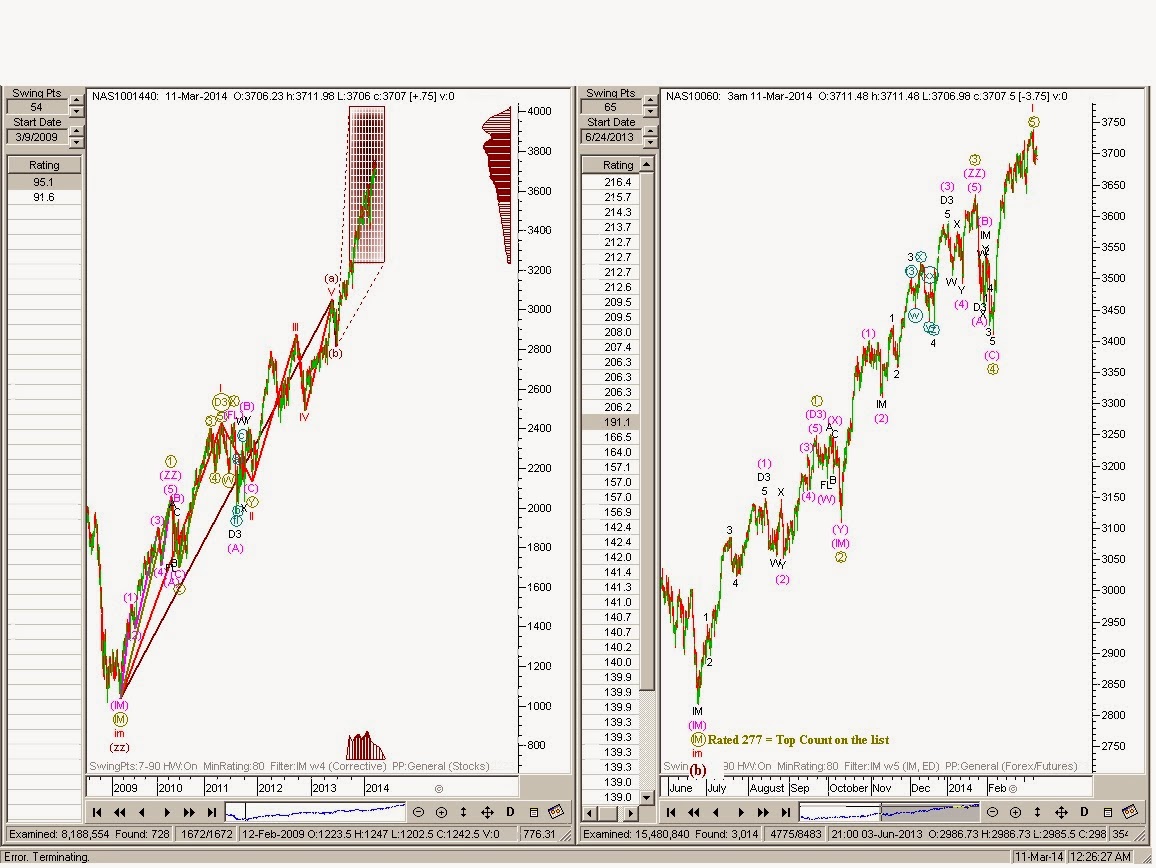 |
| The Top Count for the chart on the right at the more micro level (hourly bars) is rated 277. The pattern synchronizes beautifully with the 3rd Best Count in the chart at left. Together, the Cycle zz wave c has all 5 of the waves it needs for a completed pattern. |
Subscribe to:
Posts (Atom)

