
Thursday, October 3, 2013
Wednesday, October 2, 2013
A couple more pushes to the upside remain for Nasdaq 100 before CRASH begins
 |
| It appears the Nasdaq has a few more fumes to burn before rolling over and crashing. Intermediate (3) up, (4) down, and (5) up must complete before wave C (circled) completes. This could all take about 4 to 8 weeks. When wave C (circled) completes, Cycle (red) wave V of the Ending diagonal will be completed. When Cycle V is completed, Supercycle (burgandy) (c) will be completed. When Supercycle (c) is completed, Grand Supercycle IV down will be underway. This Grand Supercycle Wave IV should bring the Dow Jones Industrial Average to a price below 1,000! |
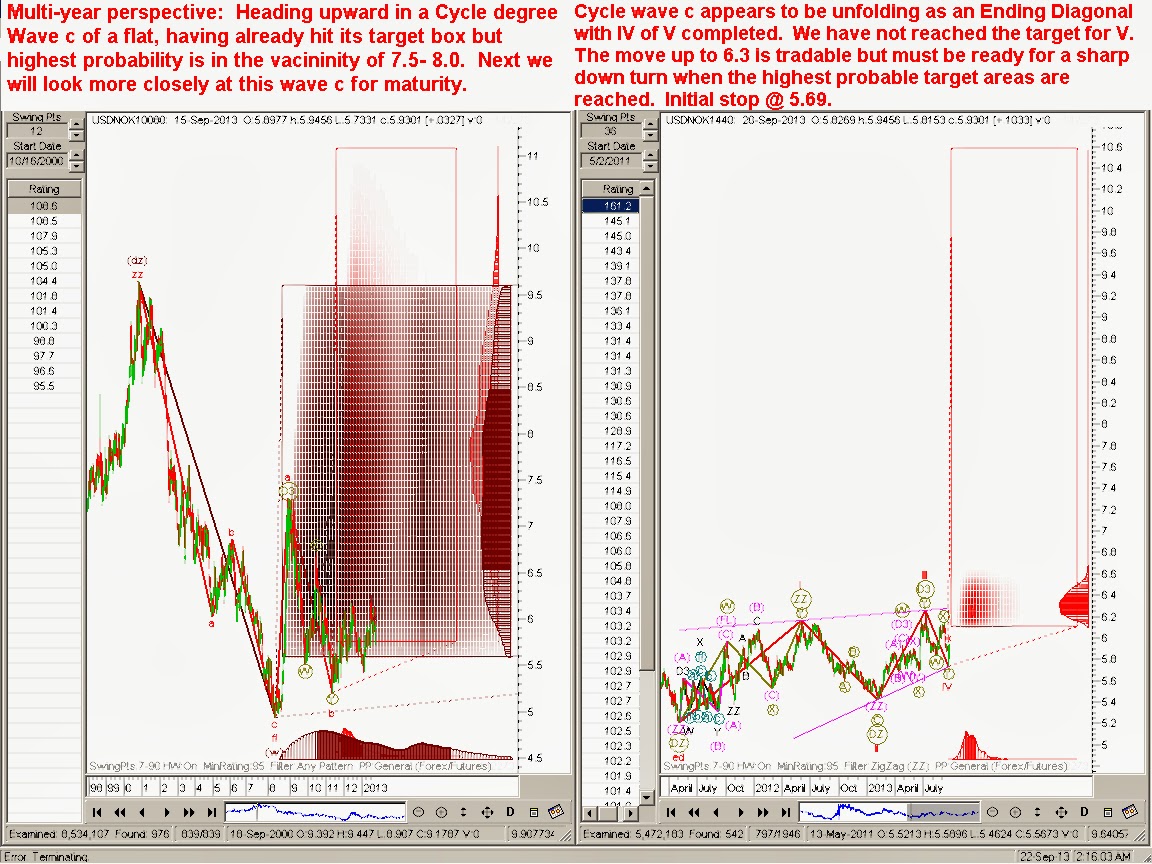
USDJPY close to finishing a major Contracting Triangle
 |
| The finish of the Ending Diagonal depicted in the chart at right, marks the end of the (ZZ) depicted in the chart at left, which then marks the end of the Primary degree Contracting Triangle. |
Saturday, September 28, 2013
QLD Presents Trade of a Lifetime!
 |
| This is one of the greatest shorting opportunities that I have ever seen. |
USDJPY Update
 |
| Intermediate Double 3 Wave (Y) is in its target. When will it turn? |
 |
| It can be interpreted that Intermediate wave (Y) is completed! |
Thursday, September 26, 2013
EURJPY approaching the completion of an Ending Diagonal
 |
| Turning to head south VERY soon! |
 |
| Wave 4 of Ending Diagonal completed. Heading up to wave 5 target. |
 |
| Wave (B) of (ZZ) eyes its target just slightly south. Wave (C) of Wave 5 up of the Ending Diagonal would then begin. |
Wednesday, September 25, 2013
Nasdaq 100 "Peak" declaration still holds as valid!
 |
| Price action off peak is called impulsive but looks suspiciously corrective. We will trust RET for now. First 2 charts are picture perfect! These type set ups don't come along very often! |
Sunday, September 22, 2013
Saturday, September 21, 2013

EURUSD up, down, up predicted short term before major sell off begins.
 |
| EUR USD will go pretty much sideway for a while before giving a modest upward thrust before a substantial sell off occurs. All this should happen by year's end. |
Friday, September 20, 2013
Nasdaq 100 potentially took its last breath above water today or NOT!
 |
| The 5th wave (predicted in the prior chart yesterday) completed and the market promptly sold off. This could be the "kick off" of a long sustained bear market. Alternately, this 5 wave move to the upside could be wave A of an upward moving ABC Zigzag, in which we would now be in wave B to the downside. Wave C then would take us to one last high to complete the ZZ. I am favoring that interpretation. It is shown below. |
 |
| The market will have to trace out Waves (B) and (C) relatively quickly to make my predicted September 30th peak deadline. Of course it doesn't have to happen on that date. I was merely speculating. More probable is a mid to late October peak. Any early Shorters of the market can utilize this wave B as an opportunity to park money on the sidelines until Wave (C) unfolds and hits its peak. |
USPJPY entering a potential 3rd of a 3rd of a 3rd
 |
| Chart #1 Multi Month / Multi Year Perspective |
 |
| Chart #2 Multi Month Perspective |
 |
| Chart #3 Multi Day / Intra Day Perspective |
Thursday, September 19, 2013
NAS 100 pushes even closer to its peak
 |
| Chart #2 only has Black Minor 4 (targets turned on) and Minor 5 to complete before the selling begins. This should happen easily within two trading sessions (3 at the most). Fasten your seat beats, the roller coaster ride down is about to begin. |
Wednesday, September 18, 2013
Nasdaq 100 Urgent Short Set Up
 |
| Chart #1: Supercycle Degree Wave (b) is ending. |
 | ||
Chart #2: Cycle degree Wave V is ending.
|

 |
| Chart #4: Intermediate degree Wave (V) is ending. |
Tuesday, September 17, 2013
GBPUSD Ripe for a Reversal
 |
| Begin reading Chart #1 in Upper Left and proceed counterclockwise for proper progression. |
Monday, September 16, 2013

Nasdaq 100 has one last breath
 |
| Wave (4) in its target with a quick wave (5) on Tuesday, then lights out! |
Sunday, September 15, 2013
Nasdaq 100 Ending Diagonal near its completion
 |
| Two possible outcomes can occur from the current price level. Described at the top off the charts. |
Friday, September 13, 2013
USDJPY nears epic turning point
 |
| Contracting Triangle final wave E is in its 3rd and final wave. Rally will follow for as long as it took the CT to complete. |
Tuesday, September 10, 2013
Tesla's Pin awaits at 180
 |
| Bubbles never end pretty. TSLA is technically ready to "Pop" when price hits 180. |
Subscribe to:
Posts (Atom)

