 |
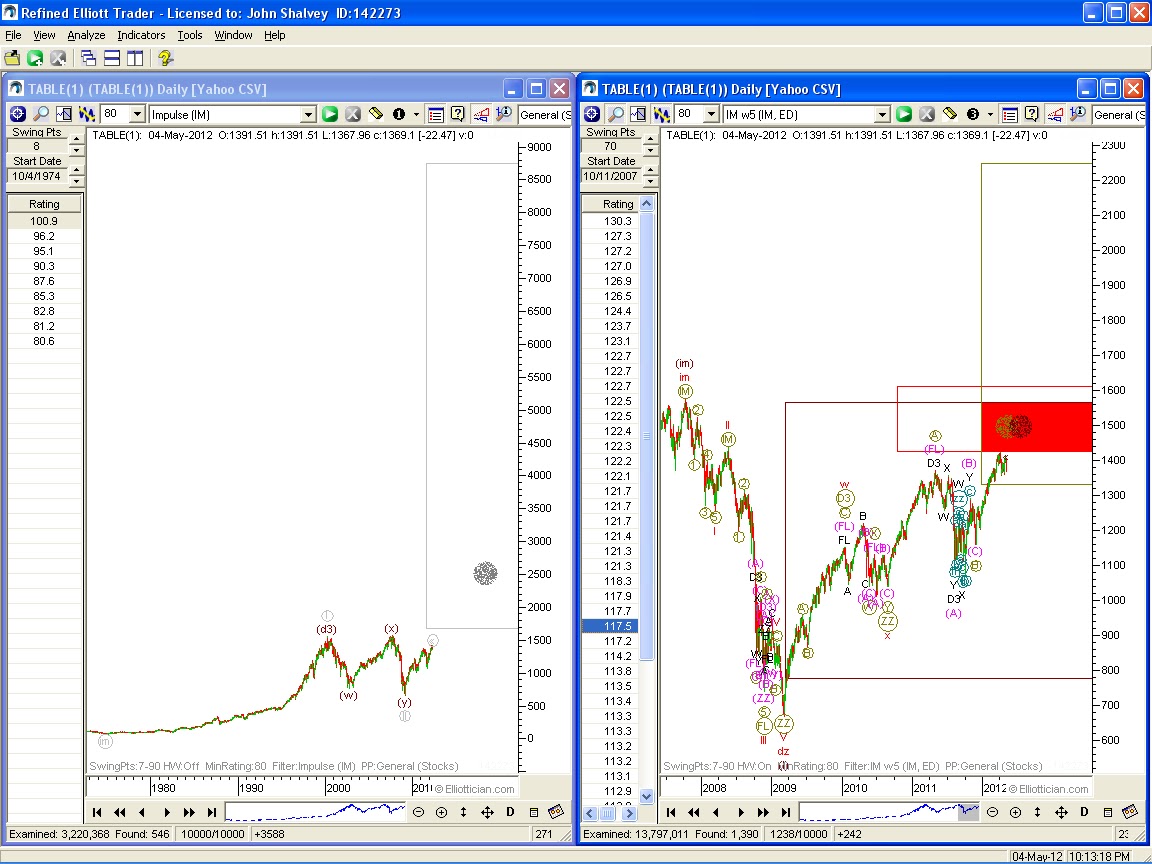
| Bullish interpretation sees a push upward to a minimum target of 1700 and a highest probable target of 2500. Bearish interpretation shows that the bear market rally wave II, which is shown as a Cycle (red) DZ with waves W & X completed and wave Y just south of its target. This Cycle wave Y is unfolding as a required ZZ with Primary (khaki) waves A & B completed and C already in its target. The darkened in red area is the space where all three degrees of trend hit their targets simultaneously and form a "Triple Bullseye". There should be serious resistance in this area and potentially a sharp move south out of this zone as Supercycle (burgandy) wave III gets underway. |
Friday, May 4, 2012
S & P 500 Index Bull & Bear Interpretations
Subscribe to:
Post Comments (Atom)


No comments:
Post a Comment